Also see: https://github.com/biovcnet/topic-R/blob/master/Lesson-6/lesson-06-bvcn-full.R
Bar
library(tidyverse)
head(starwars)
# A tibble: 6 × 14
  name      height  mass hair_color skin_color eye_color birth_year sex   gender
  <chr>      <int> <dbl> <chr>      <chr>      <chr>          <dbl> <chr> <chr>
1 Luke Sky…    172    77 blond      fair       blue            19   male  mascu…
2 C-3PO        167    75 <NA>       gold       yellow         112   none  mascu…
3 R2-D2         96    32 <NA>       white, bl… red             33   none  mascu…
4 Darth Va…    202   136 none       white      yellow          41.9 male  mascu…
5 Leia Org…    150    49 brown      light      brown           19   fema… femin…
6 Owen Lars    178   120 brown, gr… light      blue            52   male  mascu…
# ℹ 5 more variables: homeworld <chr>, species <chr>, films <list>,
#   vehicles <list>, starships <list>
Star Wars visuals
What species are present on each planet?
Create a bar plot where the x axis equals homeworlds and the y axis show the number of different species on each planet.
Point & line
For all humans in Star Wars, what is their relationship between height and weight? and is it impacted by their planet of origin?
First what is the data I’m looking at on Tatooine
# View(starwars)

tatooine <- starwars %>%
  filter(homeworld == "Tatooine") %>% # select only those from Tatooine
  data.frame
How many species on Tatooine?
unique(starwars$species); length(unique(starwars$species))
 [1] "Human"          "Droid"          "Wookiee"        "Rodian"
 [5] "Hutt"           NA               "Yoda's species" "Trandoshan"
 [9] "Mon Calamari"   "Ewok"           "Sullustan"      "Neimodian"
[13] "Gungan"         "Toydarian"      "Dug"            "Zabrak"
[17] "Twi'lek"        "Aleena"         "Vulptereen"     "Xexto"
[21] "Toong"          "Cerean"         "Nautolan"       "Tholothian"
[25] "Iktotchi"       "Quermian"       "Kel Dor"        "Chagrian"
[29] "Geonosian"      "Mirialan"       "Clawdite"       "Besalisk"
[33] "Kaminoan"       "Skakoan"        "Muun"           "Togruta"
[37] "Kaleesh"        "Pau'an"
unique(tatooine$species); length(unique(tatooine$species))
Bar chart example
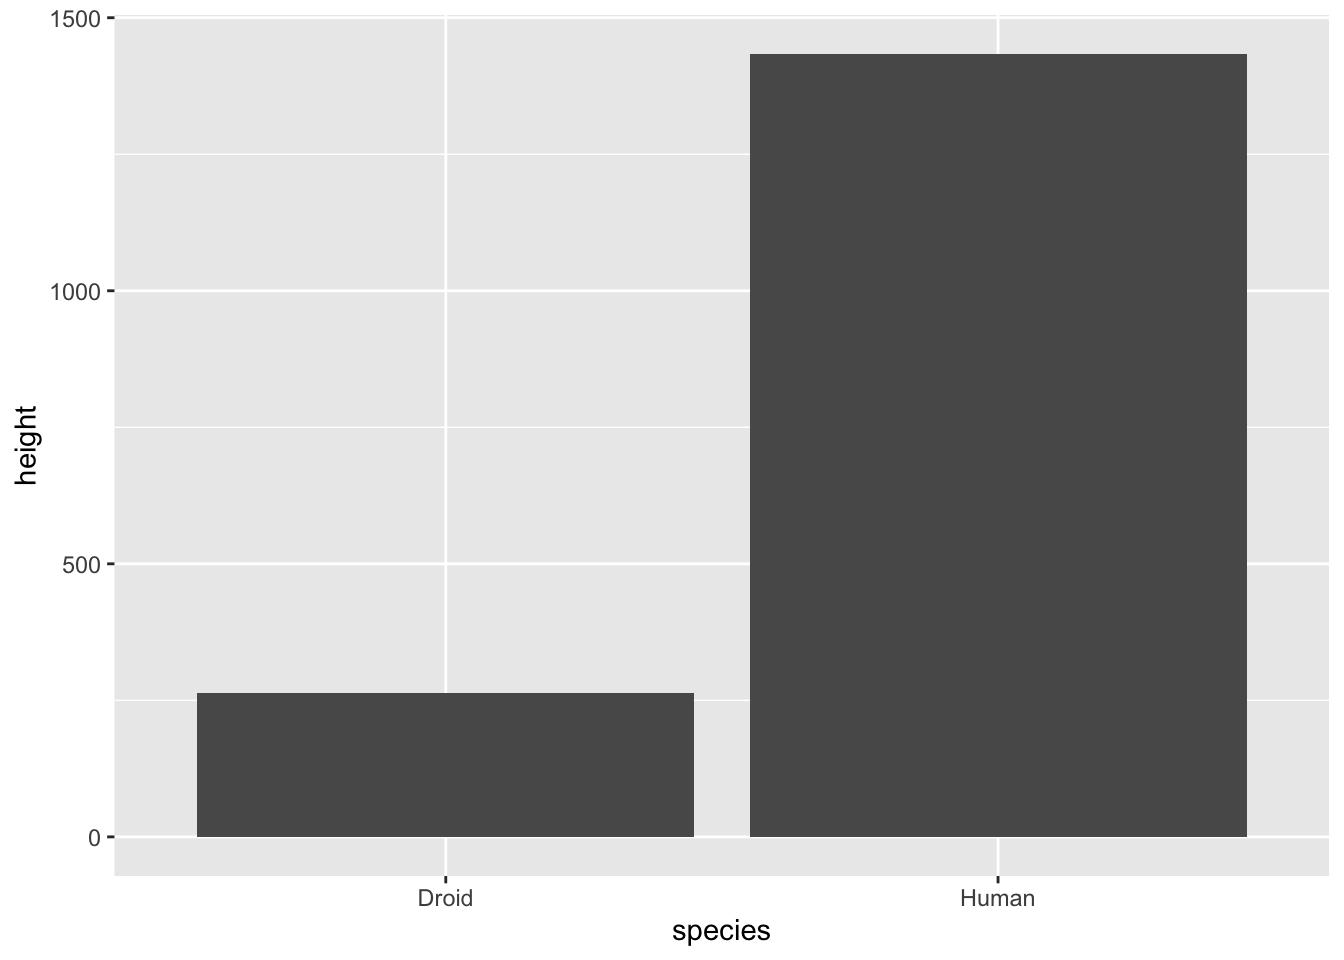
First, example of a bar chart but something isn’t right
ggplot(tatooine, aes(x = species, y = height)) +
  geom_bar(stat = "identity")
What’s wrong with this?
starwars %>%
  filter(homeworld == "Tatooine") %>%
  group_by(species, homeworld) %>%
  summarise(MEAN_height = mean(height), MEDIAN_height = median(height),
            MAX_height = max(height), MIN_height = min(height),
            MEAN_mass = mean(mass), MEDIAN_mass = median(mass))
`summarise()` has grouped output by 'species'. You can override using the
`.groups` argument.
# A tibble: 2 × 8
# Groups:   species [2]
  species homeworld MEAN_height MEDIAN_height MAX_height MIN_height MEAN_mass
  <chr>   <chr>           <dbl>         <dbl>      <int>      <int>     <dbl>
1 Droid   Tatooine         132           132         167         97      53.5
2 Human   Tatooine         179.          180.        202        163      NA
# ℹ 1 more variable: MEDIAN_mass <dbl>
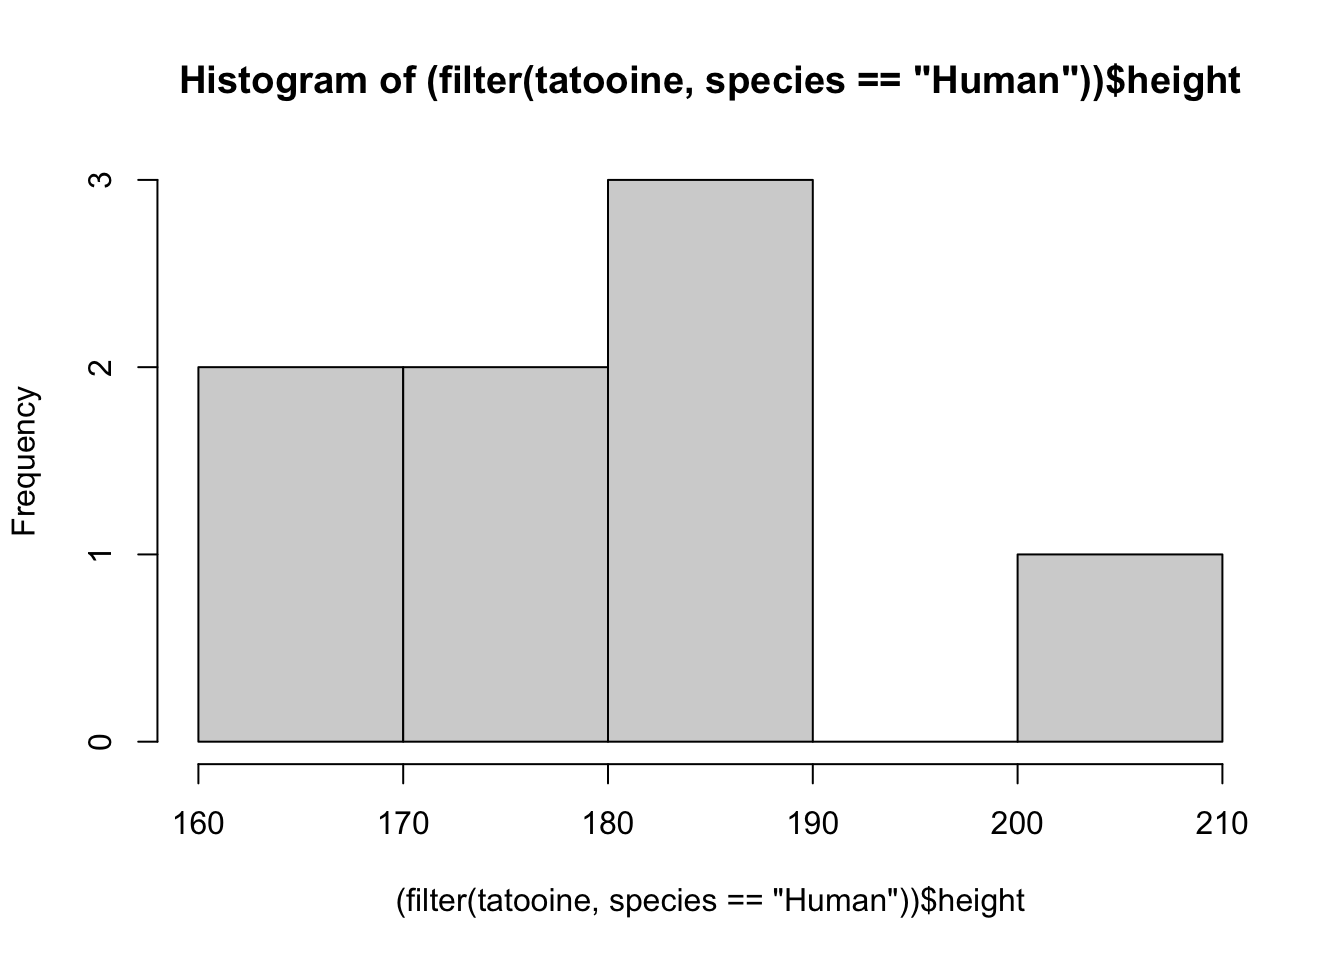
hist((filter(tatooine, species == "Human"))$height)
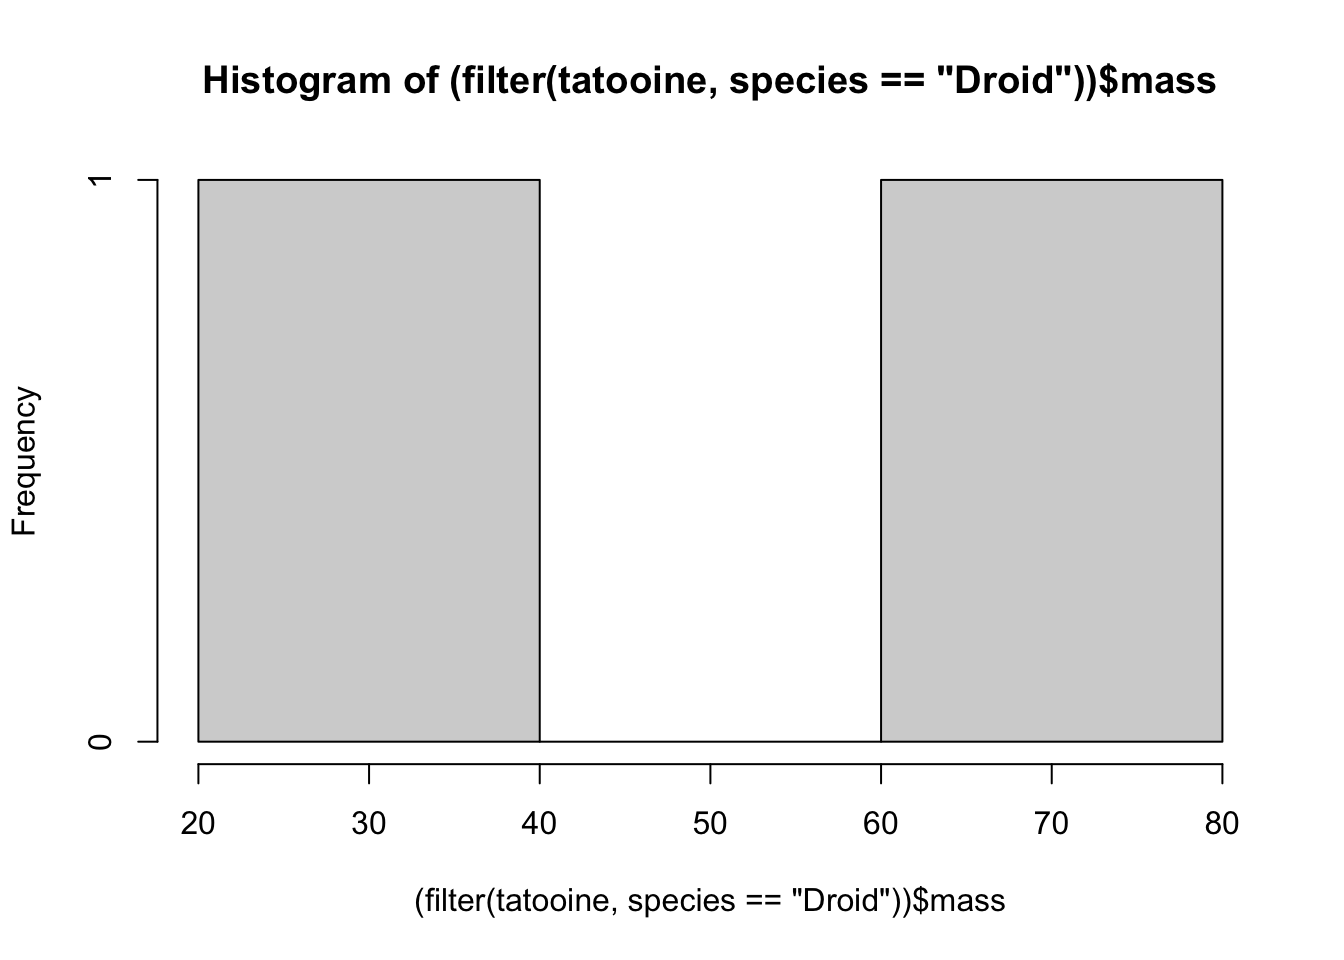
hist((filter(tatooine, species == "Droid"))$mass)
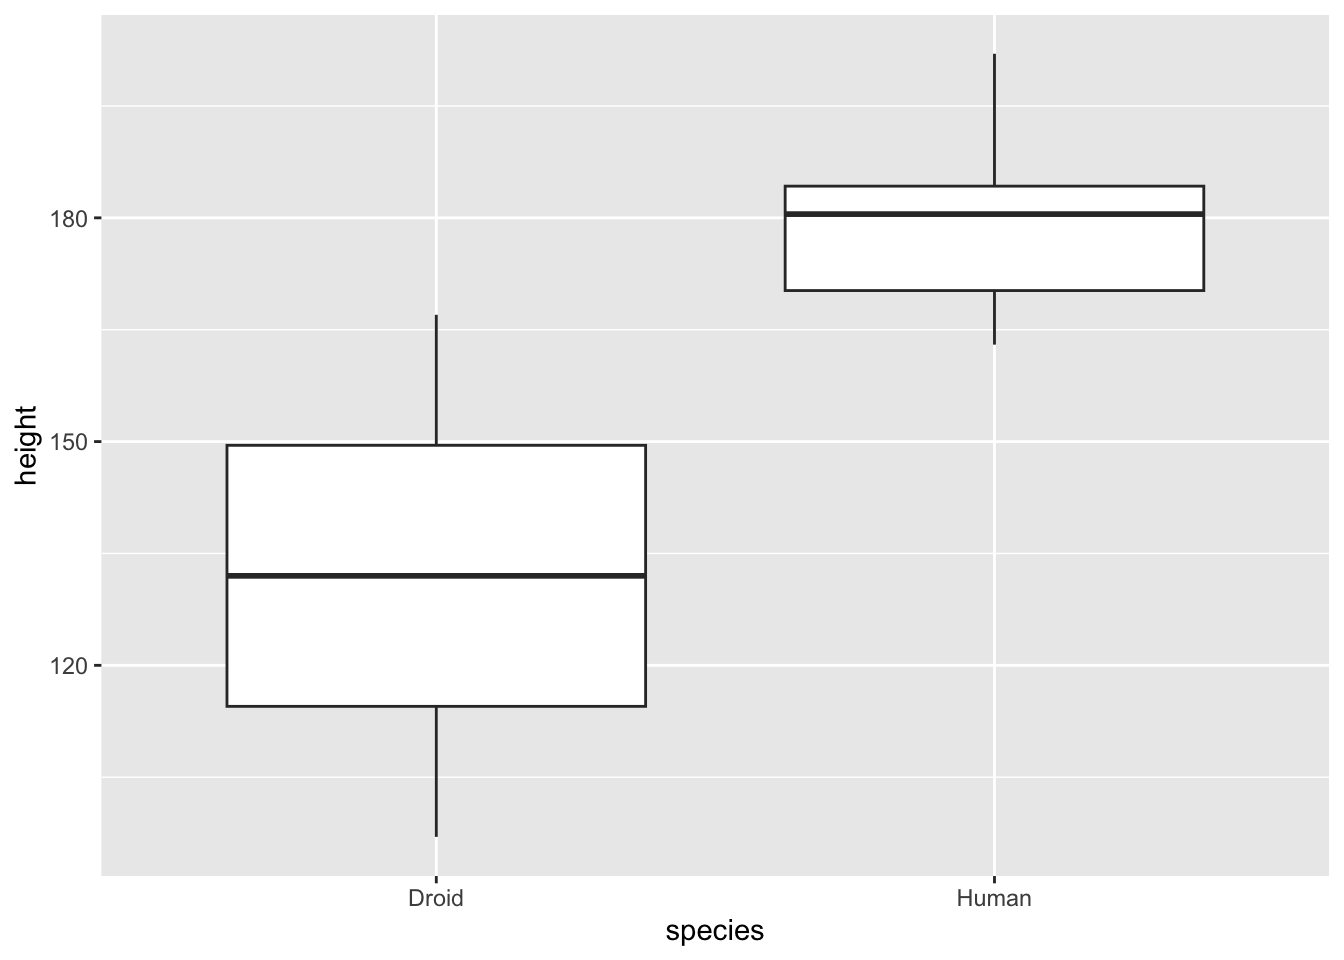
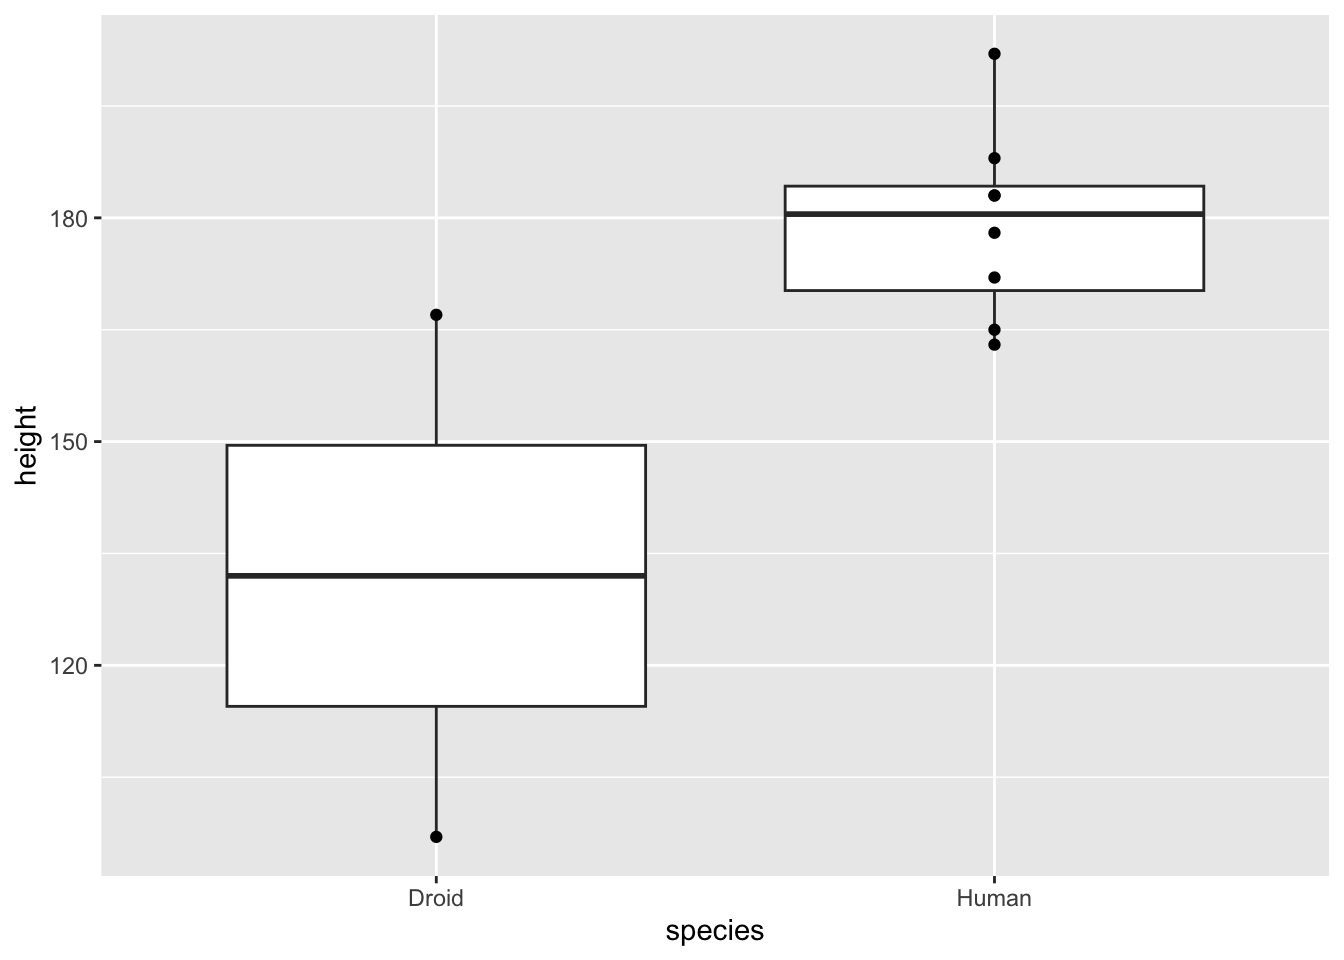
A better way to show this data is via box plot! Let’s address that question now, but with a better graphical representation
ggplot(tatooine, aes(x = species, y = height)) +
  geom_boxplot()
Boxplots in ggplot:
- median at middle
- upper/lower hinges = 1st and 3rd quartiles (25th and 75th percentiles)
- whiskers = largest/lowest value, but maxes at 1.5 * inter-quartile range (distance from upper/lower hinges)
- Outliers are shown as points
- NOTE: varies from base R ‘boxplot()’
ggplot(tatooine, aes(x = species, y = height)) +
  geom_boxplot() +
  geom_point()